CURRENT FLOW & VOLTAGE ANIMATION IN TINACLOUD
CURRENT FLOW & VOLTAGE ANIMATION IN TINACLOUD
Jump to TINA Main Page & General Information
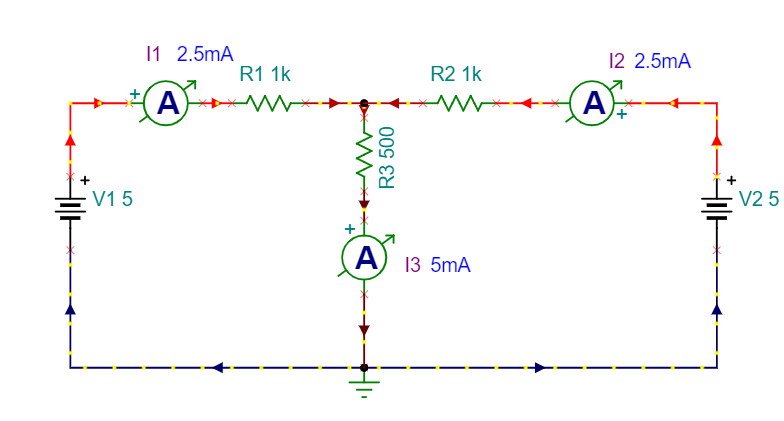
TINACLOUD can demonstrate the current flow with running dashes and mark the direction of the currents with filled current arrows. When a current is zero, the current arrow is not displayed.
The value of voltages is also indicated by the color of the dashes (wires). Positive values are red, and negative values are blue. The program calculates the maximum voltages. The maximum positive voltage is marked by red RGB (1,0,0), and the zero voltage is marked by black RGB (0,0,0). When the voltage is less than the maximum, the color is proportionally darker, and finally, when the voltage is zero, the dashes stop moving and the color of the dashes is black. Negative voltages are colored blue starting with RGB (0,0,1).
The following animated GIF picture presents this through the interactive DC analysis of the T-pad DC Animation.TSC included in TINACloud in the Animation of Currents and Voltages folder.
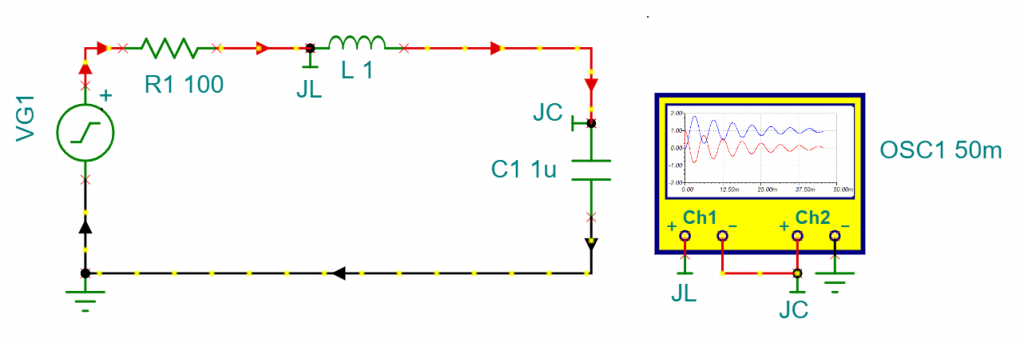
Currents and voltages can be also animated through interactive transient analysis (TR). The following animation
The following animated GIF picture presents this through the interactive transient (TR) analysis of the Transient Animation RLC 1 Circuit.TSC example circuit file included in TINACloud.

EXAMPLES BY TOPICS
BASIC CURRENT
DIRECT CURRENT (DC)
- Ohms Law Example 1.TSC
- Ohms Law Example 2. TSC
- Ohms Law Example 3. TSC
- Ohms Law Example 4. TSC
- Resistors in Series Example 1.TSC
- Resistors in Series Example 2.TSC
- Resistors in Series Example 3.TSC
- Resistors in Series Example 4.TSC
- Resistors in Series Example 5.TSC
- Resistors in Parallel Example 1.TSC
- Resistors in Parallel. Example 2.TSC
- Resistors in Parallel. Example 3.TSC
- Resistors in Parallel. Example 4.TSC
- Series-parallel connected resistors Example 1. TSC
- Series-parallel connected resistors Example 2. TSC
- Series-parallel connected resistors Example 3. TSC
- Series-parallel connected resistors Example 4. TSC
- Series-parallel connected resistors Example 5. TSC
- Wye to delta and delta to wye conversion Example 1. TSC
- Wye to delta and delta to wye conversion Example 2. TSC
- Wye to delta and delta to wye conversion Example 3. TSC
- Voltage Division Example 1.TSC
- Voltage Division Example 2.TSC
- Voltage Division Example 3.TSC
- Voltage Division Example 4.TSC
- Voltage Division Example 5.TSC
- Current Division. Example 1.TSC
- Current Division. Example 2.TSC
ALTERNATIVE CURRENT (AC)
TIME DOMAIN (TRANSIENT)

